


The Liberal-National Coalition has consolidated its ascendancy over Labor that began to emerge in the second week of the campaign, and may even be increasing it.
The latest Newspoll, taken on 31 August-1 September, shows the Coalition leading 54-46% on the two-party-preferred vote - a movement of one point in the Coalition’s favour since the previous week’s poll, and replicating the Newspoll standings of two weeks ago.
At the same time, other national polls taken in the past week show the Coalition leading Labor 53-47%. Essential Media released their latest poll today showing the Coalition ahead 53-47%. Essential was also the odd one out three weeks ago, showing Labor leading 51-49%, when Morgan, Galaxy, ReachTEL, Nielsen and Newspoll were all showing the Coalition in front.
Preferred Prime Minister
The data on leadership and preferred prime minister in the past week were much less clear. Essential and Galaxy had Kevin Rudd ahead, ReachTEL and Newspoll had Tony Abbott ahead. At least some of this contrariness arises from differences in the question. Some polls ask whether people approve or disapprove of the way each leader is doing his job, while others ask who would make the better prime minister or who the voter would prefer to see as prime minister.
Having said that, the overall trend is running in favour of Mr Abbott.
Essential had Mr Rudd’s approval level down four points to 41%, but still ahead of Mr Abbott’s which was unchanged on 37%. ReachTEL had both of them unchanged -- Mr Abbott leading Mr Rudd 53-47% as preferred prime minister. Galaxy had Mr Rudd ahead 45-39%, and Newspoll had Mr Abbott ahead 43-41%.
Individual electorates
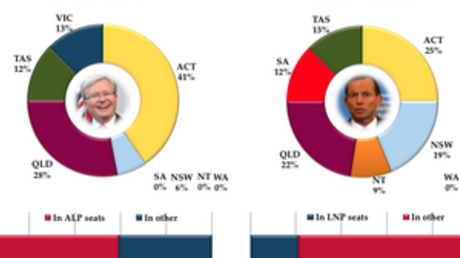
Even messier than the data on leadership are the results from polls in individual electorates. The Weekend Australian republished results from the New South Wales Central Coast seats of Dobell and Robertson, and added to them results from later polling in three more New South Wales seats – Page, Kingsford-Smith and Eden-Monaro.
It summed these into a single voting population and reported the results on that aggregated basis. This yielded a two-party-preferred vote across those seats of 53-47% for the Coalition on an aggregated sample of 1,106. However, while this gives a combined result with a sampling variance of plus or minus about 3.2 percentage points, it is not giving results with anything like that level of precision for any one of the individual seats. So translating this into seats likely to be won or lost is a risky business.
The same applies to two other similar aggregations in The Weekend Australian. One covered five seats in western Sydney – Parramatta, Reid, Banks, Lindsay and Greenway – where a combined sample of 800 (variance about plus or minus 3.5 percentage points) yielded a two-party-preferred vote of 57-43% for the Coalition. The other aggregation covered three seats in Victoria – La Trobe, Deakin and Corangamite – where a combined sample of 800 yielded a two-party-preferred vote of 53-47 for the Coalition.
The usefulness of these aggregations lies mainly in their general indication of the direction of people’s voting intention, rather than in what they are saying about the level of voter support in any one seat.
The Sunday Herald Sun got a little over-excited in reporting a similar exercise based on Galaxy polling in marginal seats. It reported that an “exclusive” analysis of Galaxy polls in marginal seats suggested swings of 4% to the Liberals in these seats, “delivering a likely majority of up to 90 seats in the 150-seat Parliament”.
Strictly speaking, that allows for a majority of anything between 1 and 90, but a majority of 90? Despite the near unanimity of the polls, even the most extreme result does not indicate that the Coalition might end up with 120 seats to everybody else’s 30. We have moved here from probability theory to improbability theory.
This was not the only bit of improbability theory floating around in the past week. The other came in the form of the “Headline Worm”, which purports to measure perceived bias in headings and sub-headings across major Australian media websites.
The 'headline worm'
The worm is a new species of an old pest – the self-selecting opinion poll, or SLOP
Via a website called thenewsaesthetic.com, it possible to read an account of how this creature came into being. Nic Hodges, who is Head of Innovation & Technology at the media-buyer MediaCom Australia, wrote an article dated 19 August in which he said he spent a few hours over the preceding weekend building something to analyse bias in online media coverage of the election.
He was moved to do this, he said, by what he called the media “frenzy” over the return to Australia of News Corp’s Col Allan to “ruthlessly execute Rupert [Murdoch’s] vision of decimating the ALP”.
Acknowledging that the headlines in Murdoch’s Daily Telegraph tended to confirm these suspicions, he went on to say that he was more interested in how bias might surface on digital platforms. So he created the Headline Worm.
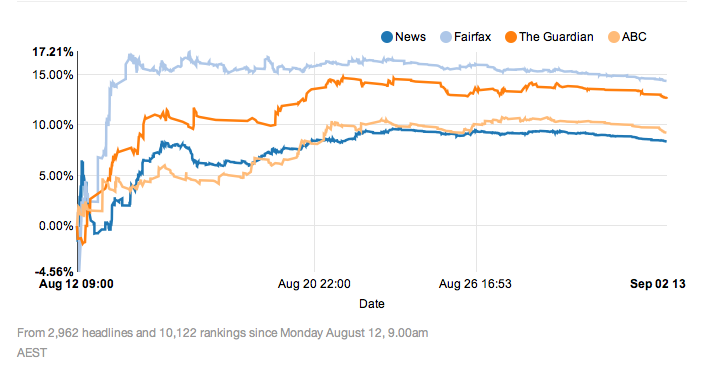
The worm, he said, “grabs every headline published by The Australian, Herald Sun, Daily Telegraph, The Age, Sydney Morning Herald, ABC and The Guardian and stores them in a database. It then charts the bias over time of each publisher based on all of those headlines”. And he went on:
“The results are somewhat surprising – and perhaps reflect more on the state of the election and the parties than the bias of publishers. While both Fairfax and the Guardian are more left-leaning, the ABC remains almost neutral with News sitting slightly to the right of the ABC.”
How were these “somewhat surprising” results arrived at?
Mr Hodges reported that since he set the worm in motion on 12 August, it had collected more than 2,000 headings, which had been given 9,969 rankings. The question is, by whom? The answer is, we do not know. What we do know, because Mr Hodges told us in this pleasingly candid paragraph, is that the system is open to manipulation. In his FAQs section, he said:
What stops someone just spamming the rankings? There’s an automated way to stop this. I am however keeping the spammy rankings in a separate database to analyse at the end of the election. Because IP addresses are recorded with rankings I’ve already noticed some interesting geographical trends. I’d also suggest if you work for a publisher you shouldn’t be submitting 187 rankings in a row with the same bias (but thanks for caring so much).
In response to some questions from Poll Watch, he was equally forthcoming:
The way I wrote the code it looks for suspect voting. Essentially it looks for a high percentage of non-neutral votes coming from a single IP, and then reports that to me. If it's clearly suspect, or if someone just clearly doesn't understand the concept (ie a high number of both ALP and Lib votes, but no neutral), it gets flagged and then I can remove those votes from the database.
So far there've been 33 individual IP addresses where I've removed votes. I haven't counted the total or checked which way the majority voted, but will do that at the end. Early on I was looking up the location of the IP address both geographically and via a traceroute - and that's where I noticed the publisher.
In fact with the best will in the world there is no sure way to stop this, so the worm is a new species of an old pest – the self-selecting opinion poll, or SLOP. These are generally harmless, being confined to questions about whether, for example, Hawthorn’s Buddy Franklin should get a suspension for his bump on his Sydney Swans opponent at the weekend. But when they trespass into serious issues, such as media bias during an election, they corrupt public discourse.
In this case, the data provided grist for News Corp’s self-propagandising mill and, by extension, for its declared campaign to see the Labor Government defeated at the election. The Australian seized on the data to publish a story on 27 August, which began:
An experiment by a media technologist suggests headlines for elections stories on websites published by The Guardian's Australian arm and Fairfax Media are more biased than those on News Corporation sites.
While Guardian and Fairfax headlines lean to the Left, the trial research has found headlines and sub-headings on online political stories written for the ABC and News Corp Australia are trending at or near neutral.
Towards the end of the article Mr Hodges was quoted as saying his experiment was not “scientific or academic research”.
You can say that again.
In addition to sample manipulation, there is the question of how to measure bias or -- to put it another way – impartiality of news content. There is in fact a way to do this, but it does not include the standardised presentation of headings, stripped of context and display, as the worm’s database does.
So if it is not science, what is it?
The tenor of Mr Hodges’ own description of his methodology – and his candour -- suggests it was an idealistic if somewhat naive attempt to do something important. It is a pity – but entirely foreseeable – that it would be exploited by anyone for whom its findings represented an opportunity, and The Australian duly obliged.