


The published opinion polls performed well against the election result, as the table here shows:
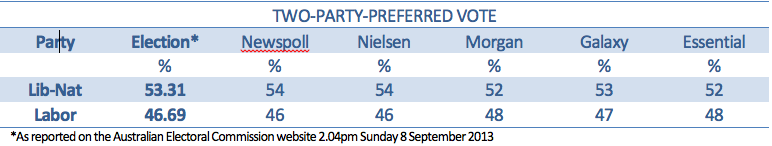
The samples for these polls ranged between 1000 and 1500, which means the sampling errors ranged between about plus or minus 2.6% and plus or minus 3.2%.
Newspoll and Nielsen, in their final polls taken over the final four days before the election, produced results that were within 0.69% of the actual election result as it stood on the day after the election. Galaxy’s final poll was closer still, within 0.31%, and the remaining two, Morgan and Essential, were within 1.31%.
So all the published polls produced final results on the two-party-preferred vote that were well within sampling error.
They also performed well in estimating the primary vote of the main parties. For example, Newspoll and Nielsen estimated Labor’s primary vote at 33% and the Coalition’s at 46%. The official count on the day after the election was Labor 33.85% and the Coalition 45.36%.
One point about Newspoll: From time to time during the campaign there was some baseless criticism of Newspoll as being biased in favour of the Coalition. This criticism seemed to stem from a tendency to conflate the poll with the newspaper - The Australian - in which its results were published. It is also true that Newspoll was established by News Corp, which publishes The Australian.
However, Newspoll’s performance - in this election and over the long haul - speaks for itself: it is a highly professional polling organisation.
Having said that, the way some of the Newspoll data were assembled and published in The Australian contains lessons about the inadequacies of aggregating data across a number of seats and then presenting the results as suggesting that the aggregated results are saying something reliable about voting intentions in any one of the aggregated seats.
The Australian published three of these aggregations, and did so in a way that built up expectations of an electoral catastrophe for Labor.
The trick here was to treat a group of seats as a single population, add the samples from those seats together and then present a two-party-preferred result for the seats as a group. The clear implication was that the group result was telling us the voting intention patterns in each of the seats individually, with the level of precision indicated by the total sample size. This was a misleading thing to do, as the following analysis shows.
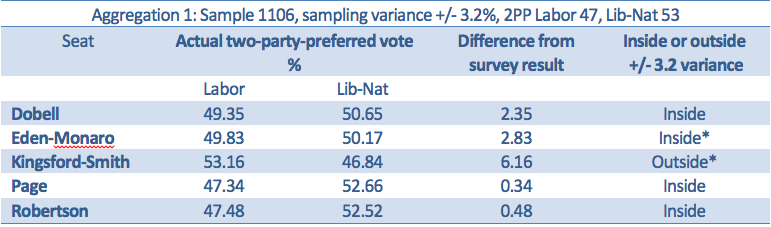
It can be seen that while all but one of the results were inside sampling variance, the two asterisked seats look like being retained by the Labor Party, although Eden-Monaro is still close. These seats are all in New South Wales: Kingsford-Smith is near Sydney Airport, Dobell and Robertson are on the Central Coast, Page is on the far north coast and Eden-Monaro on the far south coast.
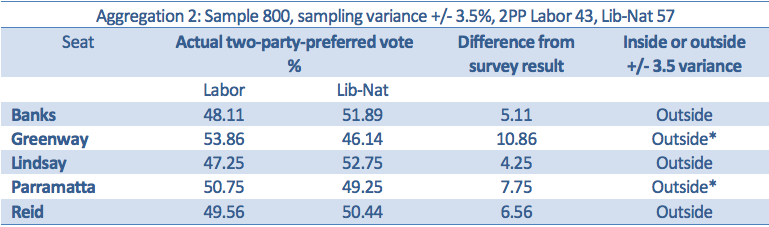
Not one of the results in this aggregation of western Sydney seats came within the sampling variance suggested by the aggregated data, and the two asterisked seats have been retained by Labor.
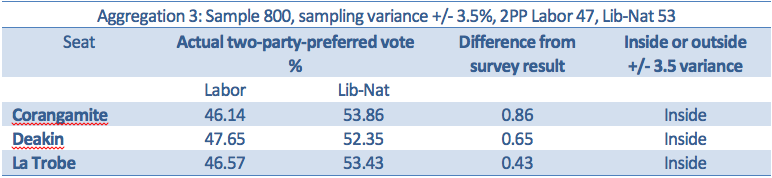
This aggregation of three seats in Victoria turned out to be accurate.
Overall, of the 13 seats involved in these aggregations, the survey results in seven seats were within the apparent sampling variances suggested by the aggregations, and six were outside. That is a far worse result than the two-party-preferred estimates gained from the standard procedures used for the national vote.
Those standard procedures consist of surveying a random sample of, say, 1000 voters across the nation and reporting the results with the sampling variance for what is a single population of interest, not a set of disparate populations added together.
It is likely that this exercise by The Australian helped to create expectations of a Labor bloodbath, because these aggregated results were picked up and re-published, especially in radio bulletins, in the lead-up to election day.
These re-broadcasts simply reported the headline findings, without any analysis of the level of confidence attaching to the data. That is what happens with the electronic media. They have neither the time nor, in most cases, the resources to interrogate the data in order to reveal its true worth. They rely – as they have for generations -- on the newspapers. Herein lies a further lesson.